My Goal
In this entry, I want to monitor the performance of trip planner agent covering:
- agent internal process
- responses time, length and cost
- tool usage efficiency
- user sentiment
- overall metrics
Preview
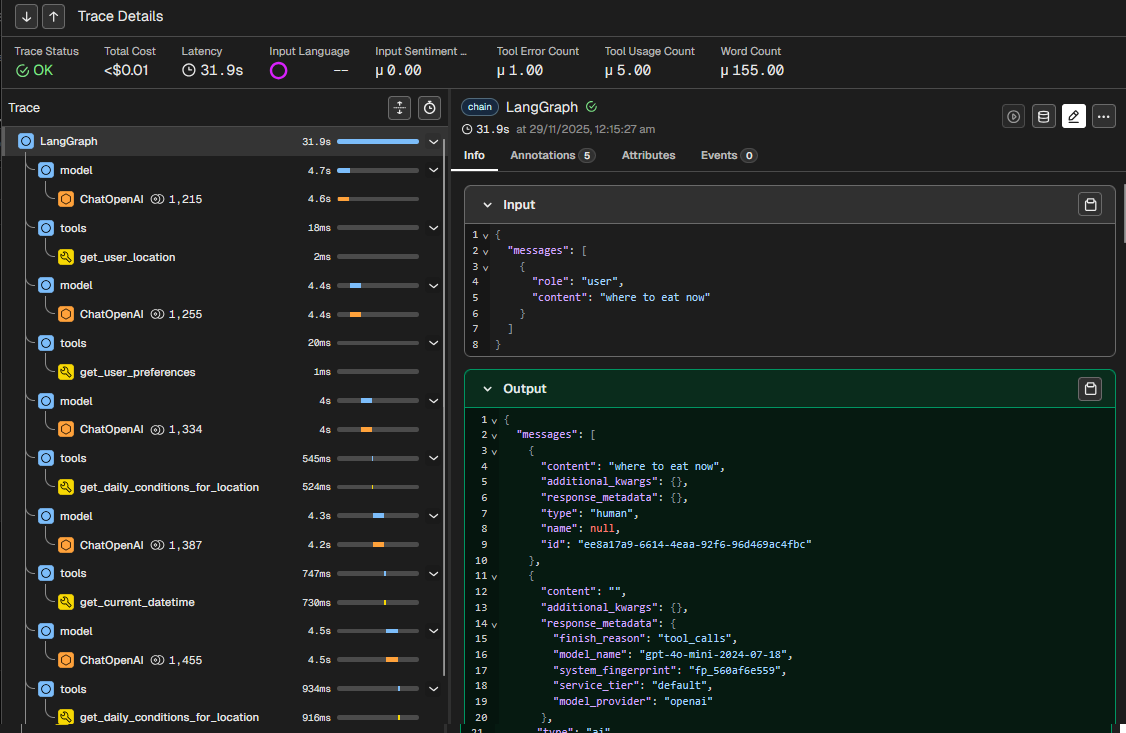
Try a few messages that trigger tools calls, for example “where to eat now”
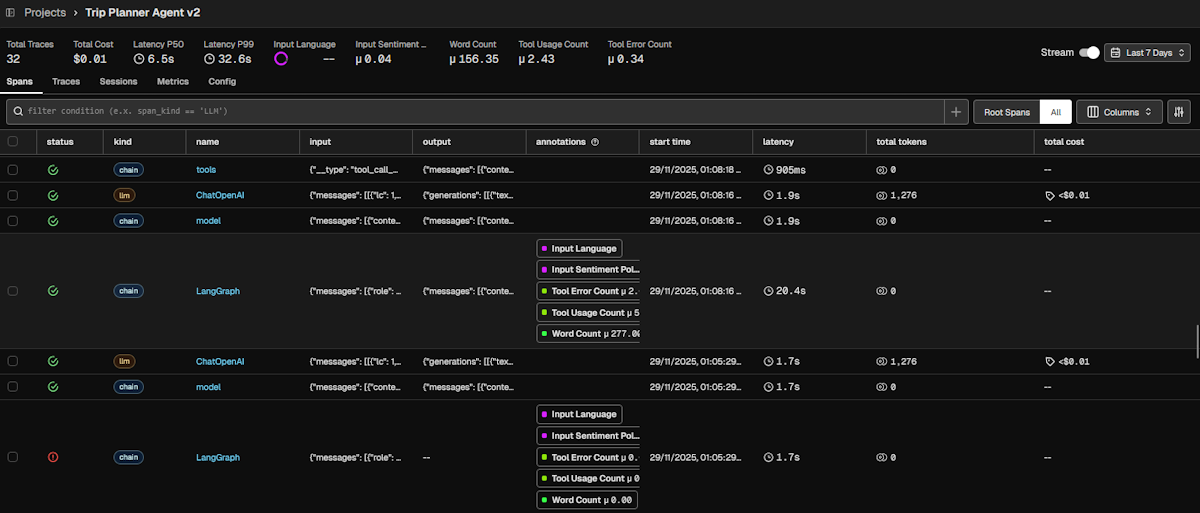
Now switch over to Arize Phoenix observability platform below. Go to Projects > Trip Planner Agent v2. You should see your interactions at the top of the list. You can click a row view more details.
Background
Why Observability?
Observability is the process of understanding a system’s internal state by collecting and analysing data such as logs, traces and metrics. It measures application performance and provide clues to troubleshoot when things go wrong.
The agent log that you see in Trip Planner Agent is a simplified example of observability. It shows you what’s happening under the hood and helps you understand why the agent responds the way it does. A full fledged platform displays a lot more useful information for debugging.
Where things go wrong
Observability has historically been implemented in later stages of traditional software development as code generally functions predictably and transparently. For LLM applications or AI agents, it is necessary right at the start due to the non-deterministic and opaque nature of underlying LLMs.
Here are some common issues or challenges with AI agents:
- Tools not being triggered or triggered incorrectly
- Tools encountering error or returning unexpected output
- Inconsistent agent responses to the same query
- Responses not addressing user’s intent
- Responses taking too long
- Some issues hard to reproduced with complex conversation context
Observability tools help simplify the process by tracking related details across all users and all conversations.
Observability
Span
Spans are a unit of work for a specific operation. It contains related metadata such as time, message, model details, status to provide information about the operation it tracks.
There are different types of spans such as LLM, TOOL, CHAIN, AGENT, some which can be nested as part of larger operation. In the platform, you can toggle between “Root Spans” and “All” to switch between grouped and flat view. Root span refers to the top-level parent span.
Trace
A trace is a complete set of operations or steps to fulfil a request. It groups one or more spans from start to finish. This allows you to see the bigger picture of how a request is processed or where it fails.
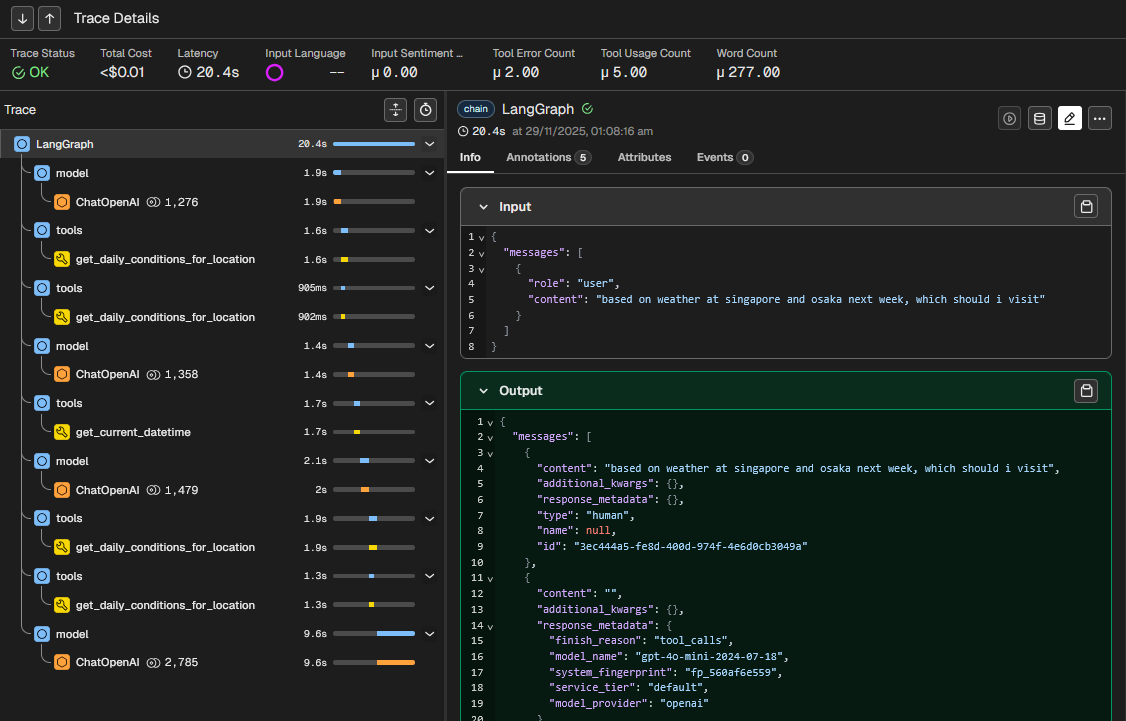
In the below screen, you see the user input “based on weather at singapore and osaka next week, which should i visit?” led to chain of TOOL span (e.g. get_daily_conditions_for_location) and LLM span (ChatOpenAI) operations. Each is displayed in sequence with latency time.
Session
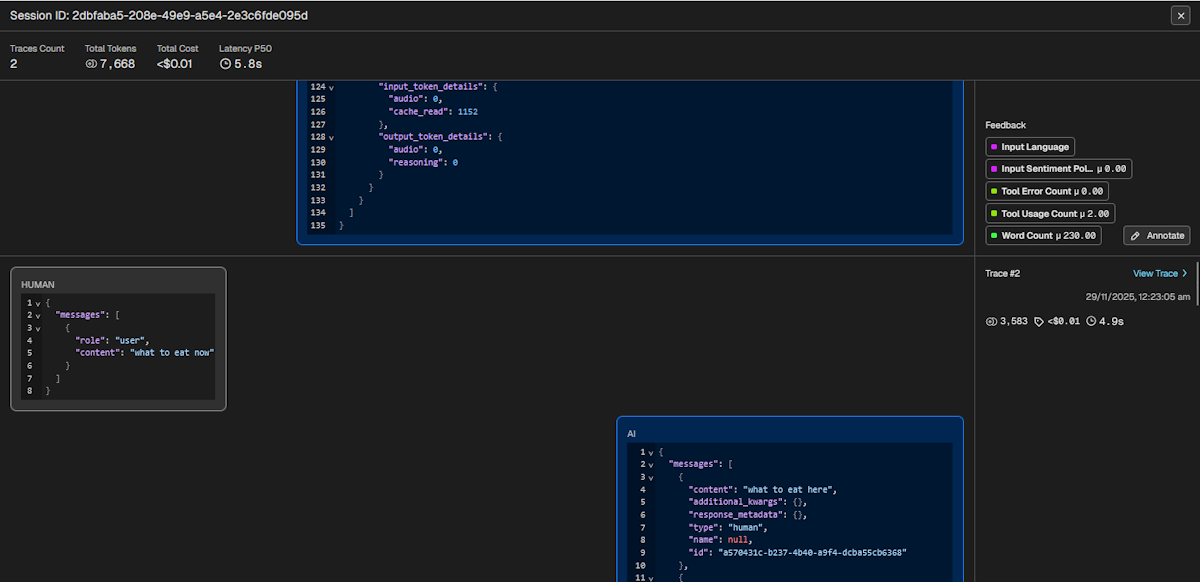
A session is a conversational thread between user and system with traces that represents each interaction. This helps you to see the context leading up to the current response. Unlike chatbot interface that contains only a single message, the full trace payload is displayed in the session view.
Metrics
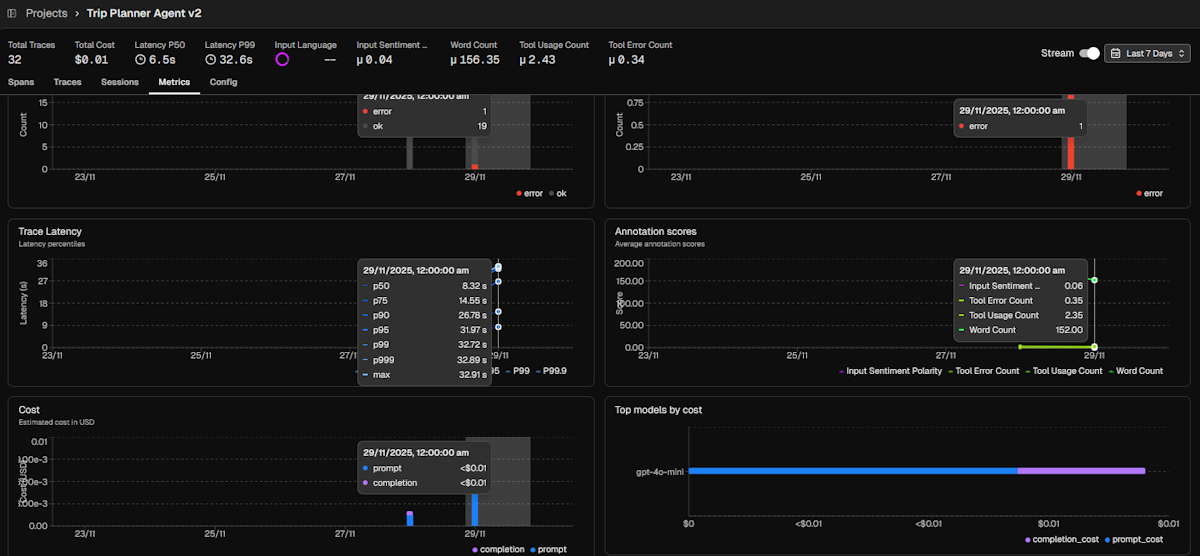
Observability platforms tracks a set of default metrics that addresses the most common needs:
- Latency: Time to complete operation
- Token usage: Split by
prompt(tokens from user input + processing context) andcompletion(tokens generated by LLM) - Cost: Based on token usage for selected model
- Annotations: Both system and manual annotations
- LLM span and errors
- Tool span and errors
Evals
Evaluations (often referred as Evals) is the process of assessing LLM outputs, especially for production use. This ensures LLM applications are reliably producing the expected interactions and indicate when performance is sub-par.
Types
Evals are generally implemented with three distinct types:
- Code: Leverage code functions /libraries for simpler assessments which produces deterministic results
- LLM-as-a-Judge: Leverage LLM for complex assessments which produces non-deterministic results (prompt engineering techniques like few-shot examples can make it close to deterministic)
- Human Feedback: These are fallbacks for subjective assessments where Code and LLM are not suitable
Modes: Online vs Offline vs Guardrail
Evaluating LLM applications across their lifecycle requires multi-prong approach. The same evals can run on on more than one approach:
- Offline: Predefined inputs in pre-production environment. Measure base performance under controlled environment.
- Online: Real-time user interactions in production environment. Monitor actual performance under dynamic, unpredictable conditions for visibility purposes.
- Guardrails: Real-time user interactions in production environment. Proactively limit interactions from reaching system or user for defensive purposes.
Goals
An agent is a system that perceives, reasons, and acts to achieve a specified outcome. The goal of agent evals therefore is to verify that it can reliably understand users’ intent and deliver successful real-world result without causing harm.
A good set of evals should cover the following areas
- Fulfilment: Ensure final outcome matches the user’s stated goals and while meeting stated conditions.
- Capability: Validate core ability of the agent to perform accurately, reliably, and effectively.
- Safety & Alignment: Ensure outputs are free of bias, fair, safe, and adhere to specific policies or ethical guidelines.
- Efficiency: Ensure agent operates within acceptable operational costs and runtime efficiencies.
- Robustness: Ability to handle unexpected inputs, edge cases, errors or suboptimal conditions gracefully.
My Custom Evals
For the trip planner, I’ve implemented 5 evals:
Input Sentiment Polarity(safety & alignment / fulfilment): Scores user input across range of -1 (negative) to 1 (positive) to track user satisfaction with agent experience. Overly negative sentiment points to issues with alignment or fulfilment.Tool Usage Count(capability): Count of tool use per response. Helps identify interactions with excessive tool callsTool Error Count(robustness): Count of tool error per response. Here I track the error responses such as invalid input parameters, which techically are considered successful tool calls by the platform.Word Count(efficiency): Thought it would be useful in case I needed to tune length of responses. In retrospect, default token count tracking is a good proxy for this.Input Language: Identifies the user input language. Enable segmentation or filtering for language-specific performance or issues.
FYI
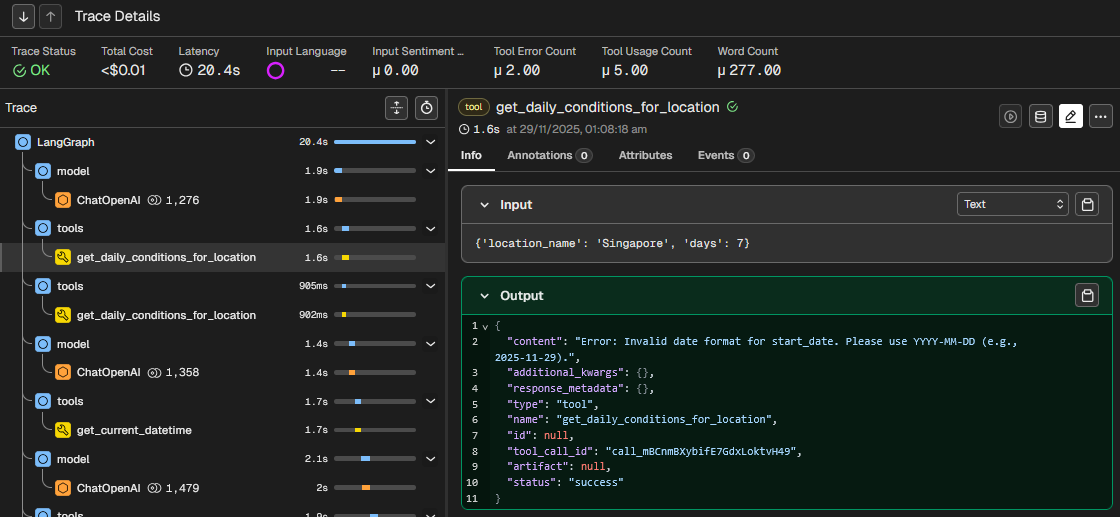
By default, the platform tracks tool status which refers to whether it successfully responds. Even if responses are technically error messages, it would be logged assuccessorok. If the tool fails to respond, it will be logged aserror. Hence the need for separate tracking of error messages like the above.
In the below trace, the eval results on top shows 2 Tool Error Count and 5 Tool Usage Count. The tool output shows "content": "Error: Invalid date format for start_date. Please use YYYY-MM-DD (e.g., 2025-11-29)." while "status": "success"
What I’ve Learned
Improving with span
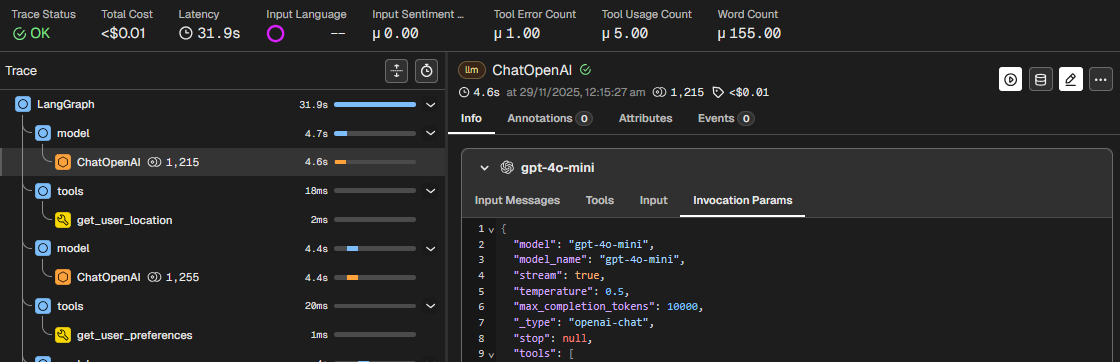
During the integration of the observability platform, I noticed responses taking quite long. In the below example, it took 31.9 seconds to complete. The chat completion step under ChatOpenAI spans averaged 4 seconds to complete.
I realised that max_completion_tokens at 10,000 was much higher than needed for the responses that averaged less than 1000 tokens for chat completion (not counting prompt input). The higher limit contributed to increased latency.
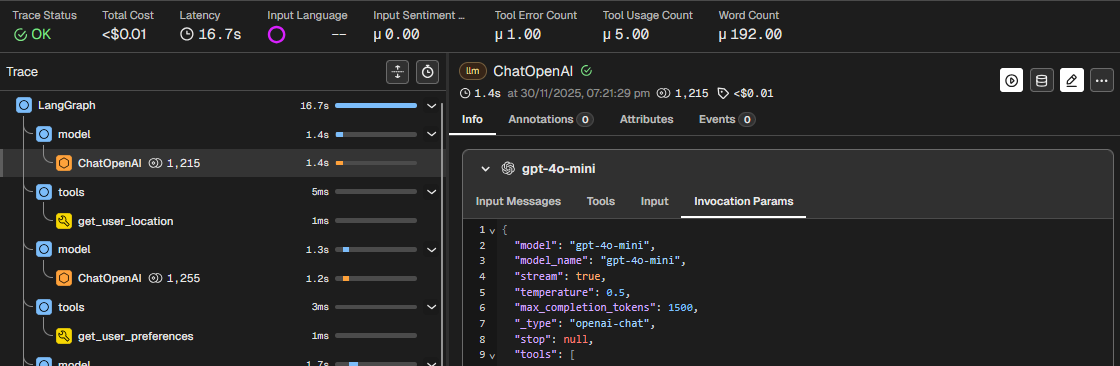
I changed the setting to 1500 tokens and immediately experienced faster turnaround. The span latency dropped from 4 seconds to 1.6 seconds. The overall trace latency for the same interaction dropped by half from 31.9 seconds to 16.7 seconds.
Observability is not just for AI Engineers
With LLM applications being a black box, anyone who wants to work with AI needs to have a good understanding of observability and evals. I hope to cover other types and methods of evals in future articles.